Steeped AI
Steeped AI is a fun web app that makes data analysis and visualization easy. It uses AI to automate tasks, making it quick to find insights.
Key Features
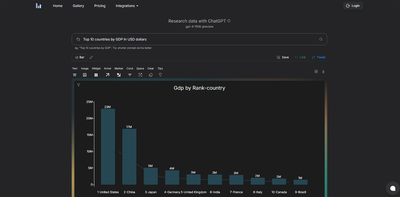
AI Chart Builder
The Steep AI chart builder helps users explore and analyze data easily. Just describe the data you need, and it creates charts based on your metrics catalog. These charts can be explored, shared, or saved to a report.
- Metrics and Chart Types: Steep AI can make charts for any metric. It includes different chart types like rank, line, and bar charts.
- Time Periods and Comparisons: Users can choose relevant time periods and compare metrics to other time periods or targets. They can get detailed breakdowns by dimension.
- Context-Aware Interactions: Steep AI understands context. Users can ask follow-up questions to refine charts and dig deeper into the data.
Benefits
Steeped AI helps users get insights from their data quickly. By automating chart generation and providing context-aware interactions, Steeped AI makes data analysis more efficient.
Use Cases
To start using Steep AI, click on the Steep AI icon in the bottom right corner of the interface. Enter a prompt, which can be specific or vague, and Steep AI will create the most relevant chart based on the metrics catalog.
Reviews/Testimonials
Since the product is in beta, there are no user reviews or testimonials provided in the article.


Comments
Please log in to post a comment.