Netlora
Internet Health Test: Latency, Jitter, Packet Loss, and Bufferbloat
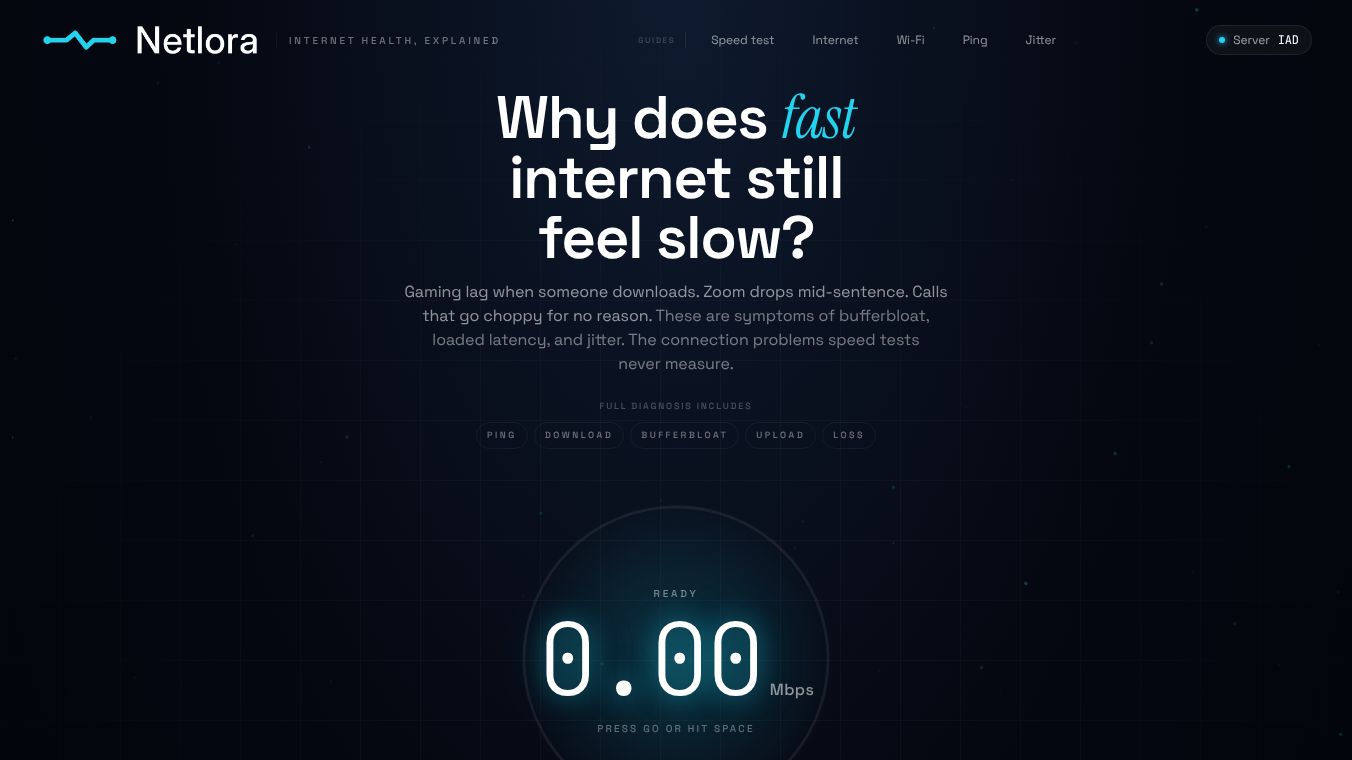
What Netlora Diagnoses
Netlora is a free, browser-based internet diagnostic tool designed to measure connection quality metrics that standard speed tests often overlook. While a standard speed test accurately measures peak throughput and idle ping, these numbers do not reveal what happens to your latency when the connection is under load. For instance, when someone in the house starts a download, a backup runs in the background, or you are on a call while streaming, hidden delays can emerge. This phenomenon, known as bufferbloat, can add 200 to 400 ms of hidden delay to real-time applications such as Zoom calls, gaming, and VoIP, making them feel slow despite a fast speed test result.
Bufferbloat occurs because routers often fill their buffers with non-real-time traffic like downloads before dropping packets or significantly increasing latency for real-time traffic. Netlora addresses this by measuring the connection quality metrics that standard speed tests skip.
The Metrics Netlora Measures
Netlora evaluates four key metrics to provide a comprehensive view of internet health.
1. Loaded Latency and Bufferbloat
Loaded latency is your ping while the connection is saturated. Netlora measures this by running download streams and latency probes simultaneously. The difference between your idle ping and this loaded ping is your bufferbloat reading.
- The Fix:For most cases, the solution is enabling Smart Queue Management on your router, specifically using the fq_codel or CAKE algorithm.
2. Jitter
Jitter is the variance in round-trip latency across consecutive probes. High jitter causes choppy audio and game stutters even when the average ping looks acceptable.
- Impact:Voice and video codecs compensate for jitter using jitter buffers. However, above roughly 20 to 30 ms of variance, these buffers overflow, leading to audible quality degradation.
3. Packet Loss
Packet loss is estimated from the fraction of HTTP probes that time out or fail.
- Impact:Even 1 to 2% loss can cause rubber-banding in games and robotic audio on calls. This is because real-time protocols using UDP cannot retransmit dropped packets.
Measurement Methodology and Privacy
The complete measurement methodology, including the health score formula and its exact component weights, is documented on the Netlora website.
Regarding user privacy, Netlora stores test results by an 8-character random ID only. No account is required, and no IP addresses are stored.
Conclusion
When your internet feels slow despite a fast speed test result, the cause is almost always bufferbloat. By utilizing tools like Netlora to diagnose loaded latency, jitter, and packet loss, users can identify these hidden issues and implement solutions like SQM to restore smooth performance for real-time applications.
This content is either user submitted or generated using AI technology (including, but not limited to, Google Gemini API, Llama, Grok, and Mistral), based on automated research and analysis of public data sources from search engines like DuckDuckGo, Google Search, and SearXNG, and directly from the tool's own website and with minimal to no human editing/review. THEJO AI is not affiliated with or endorsed by the AI tools or services mentioned. This is provided for informational and reference purposes only, is not an endorsement or official advice, and may contain inaccuracies or biases. Please verify details with original sources.


Comments
Please log in to post a comment.