Infogrammy
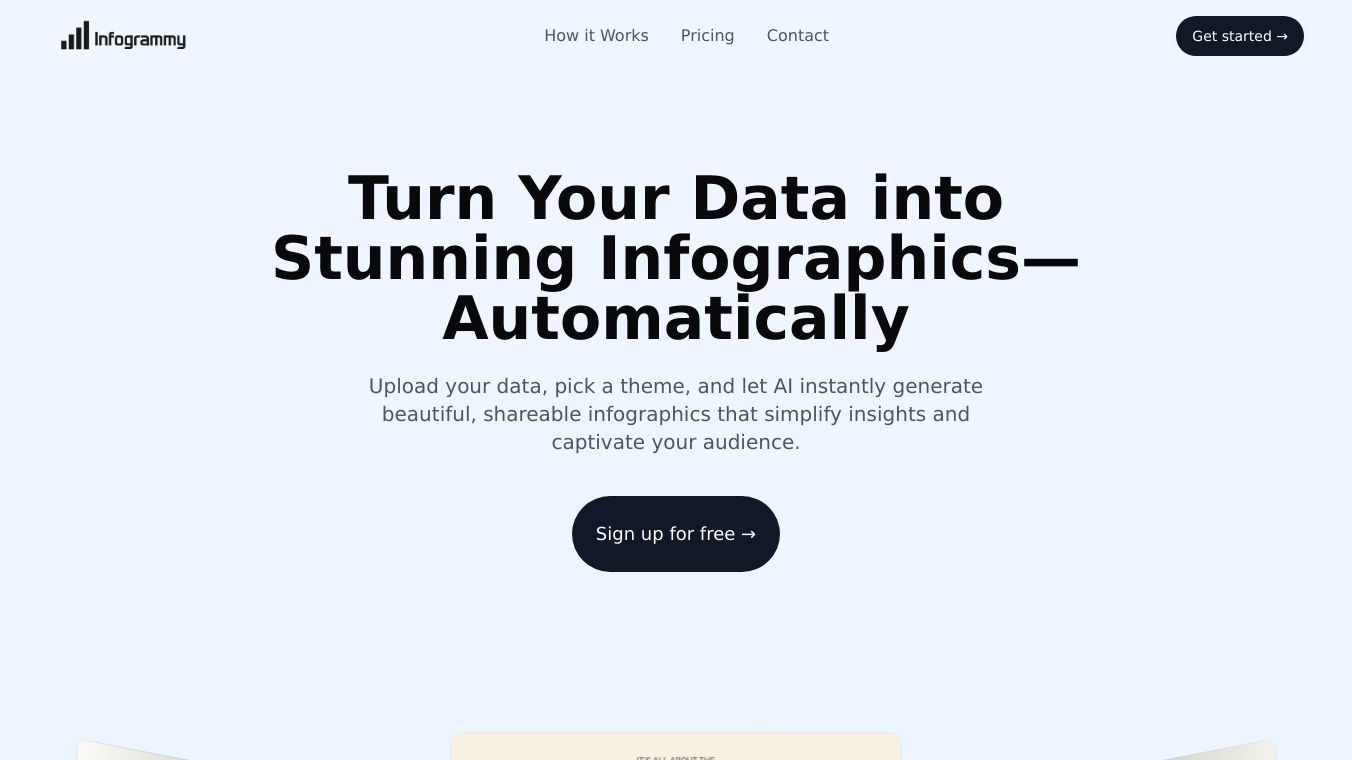
Infogrammy is a tool that uses AI to turn data into beautiful, shareable infographics in just seconds. It helps with data visualization, storytelling, and business insights. Infogrammy solves the problem of spending too much time on manual design and not having design skills. This often leads to boring, static visuals. By automating the creation of eye-catching, dynamic infographics, Infogrammy lets users upload data and generate interactive charts, maps, and timelines easily.
Benefits
Infogrammy has several big advantages. It saves time by automating the design process. This makes sure the infographics are not only pretty but also make sense. The tool''s AI picks the best chart types, colors, and layouts based on the data. This helps users show complex data in an easy-to-understand way. Infogrammy is great for data analysts, marketers, and business pros who need to make engaging visuals fast. It is especially helpful in fields like consulting, education, and media.
Use Cases
Infogrammy is perfect for many tasks. It can make informative infographics and data visualizations, engaging social media graphics, reports, presentations, and visually rich dashboards, charts, and maps. The tool''s interactive map feature lets users create maps with tooltips for extra info, clickable legends to switch between data sets, and a zoomable interface to explore the data in detail. Animated charts add fun effects like data point animations, hover effects, and scroll-activated animations, making the charts more interactive and pretty. Infogrammy also lets users add animations to static objects, making them more engaging and visually appealing. Users can add dynamic effects like zooming, bouncing, flipping, fading, and sliding to create interactive scenes that grab the audience''s attention. Page linking makes content more user-friendly by letting viewers click to topics of interest. Hover tooltips give extra context without making the design messy, and interactive chart legends let users pick and choose parts of the chart legend to explore the data in a personalized way. Tabs help organize multiple charts, making it easier for viewers to find and explore the data. Animated GIFs and stickers can be used to make articles, reports, social media posts, and email marketing campaigns more memorable and shareable. Infogrammy''s brand kit makes sure all interactive content matches the user''s brand guidelines, keeping everything consistent across projects. The tool also lets users put interactive designs right into their websites or blogs, making the user experience more dynamic and engaging.
Vibes
Since its launch two months ago on ProductHunt, Infogrammy has gotten 850 plus upvotes, 3.2k active users, and $12k in monthly recurring revenue. The founder has a big following of 2.4k on LinkedIn. The global data visualization market is expected to reach $10.2 billion by 2028, with a growth rate of 9.8 percent each year. This is because there is a big demand for tools that help with data-driven decision-making.
Additional Information
Infogrammy is part of a bigger trend in interactive content creation. As more content is made and technology changes, businesses need to use interactive content to stay competitive and get results. Infogrammy''s easy-to-use platform makes it simple for anyone, no matter their design or coding skills, to create professional-quality visualizations in just a few clicks. With its unique features and growing user base, Infogrammy is set to make a big impact in the data visualization market.



Comments
Please log in to post a comment.