HSpectrum

HSpectrum
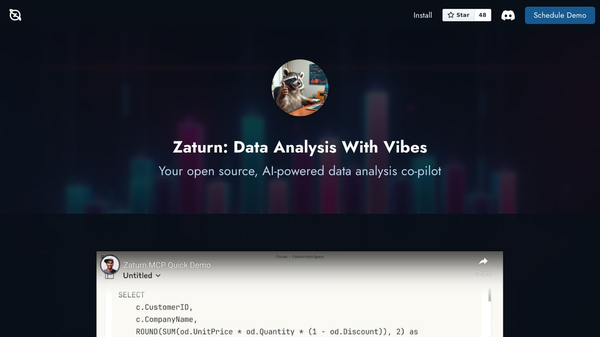
HSpectrum is a tool designed to analyze and visualize data in a unique way. It helps users understand complex information by breaking it down into simpler, more manageable parts. HSpectrum uses a spectrum of colors to represent different data points, making it easier to see patterns and trends at a glance.
Benefits
HSpectrum offers several key benefits:
- Easy Data Interpretation: By using a color spectrum, HSpectrum makes it simple to understand complex data.
- Visual Appeal: The colorful visualizations are not only informative but also visually appealing, making data analysis more engaging.
- User-Friendly: HSpectrum is designed to be intuitive, so users don't need to be data experts to benefit from it.
Use Cases
HSpectrum can be used in various scenarios:
- Business Analytics: Companies can use HSpectrum to analyze sales data, customer behavior, and market trends.
- Scientific Research: Researchers can visualize experimental data to identify patterns and correlations.
- Educational Tools: Teachers can use HSpectrum to help students understand complex concepts through visual representations.
Additional Information
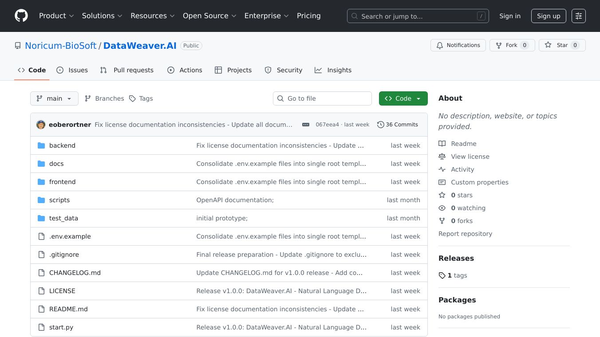
HSpectrum is a versatile tool that can be accessed via its website. It is designed to be flexible, allowing users to customize their data visualizations to suit their specific needs. Whether you are a business professional, a researcher, or an educator, HSpectrum can help you make sense of your data in a visually appealing and intuitive way.


Comments
Please log in to post a comment.