D&AVIZ
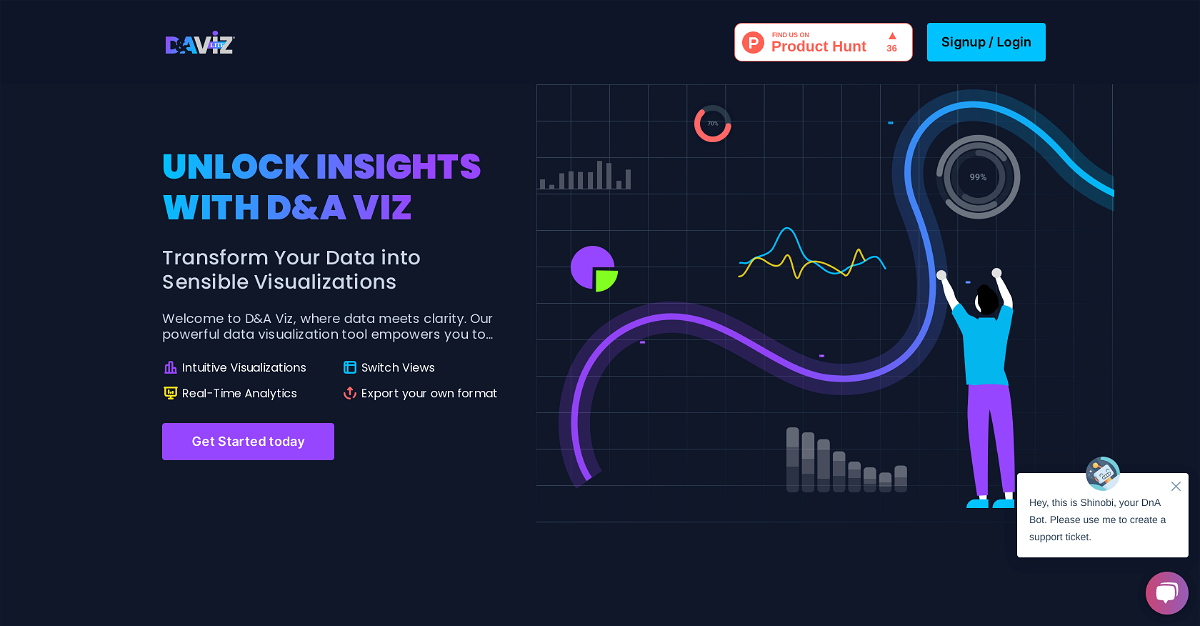
d&aviz is an AI-powered tool that transforms your raw data into stunning, interactive visualizations. Imagine your complex spreadsheets and datasets effortlessly turning into clear, engaging graphs and charts that reveal hidden trends and insights. This powerful platform lets you import data from various sources like Excel or CSV files, and then uses AI to automatically create compelling visualizations. You can even customize these visuals to perfectly match your needs, making it easy to identify patterns, understand data trends, and make informed decisions. With real-time data visualization, you gain a dynamic view of your data, allowing for accurate and timely performance monitoring. Share your findings effortlessly by creating interactive dashboards that you can easily share with your team or stakeholders.
Highlights
- Effortlessly transform raw data into interactive and easy-to-understand visuals.
- Identify hidden patterns, trends, and insights to make informed decisions.
- Gain real-time data visualization for accurate performance monitoring.
- Customize visuals to match your specific needs.
- Create interactive dashboards to share your findings with others.
Key Features
- Imports data from various sources, including Excel and CSV files.
- AI-powered automatic visualization creation.
- Real-time data visualization and updates.
- Customizable visualizations to match your specific needs.
- Create and share interactive dashboards.



Comments
Please log in to post a comment.