Data Visualization and Analysis with AI
Data Visualization and Analysis with AI
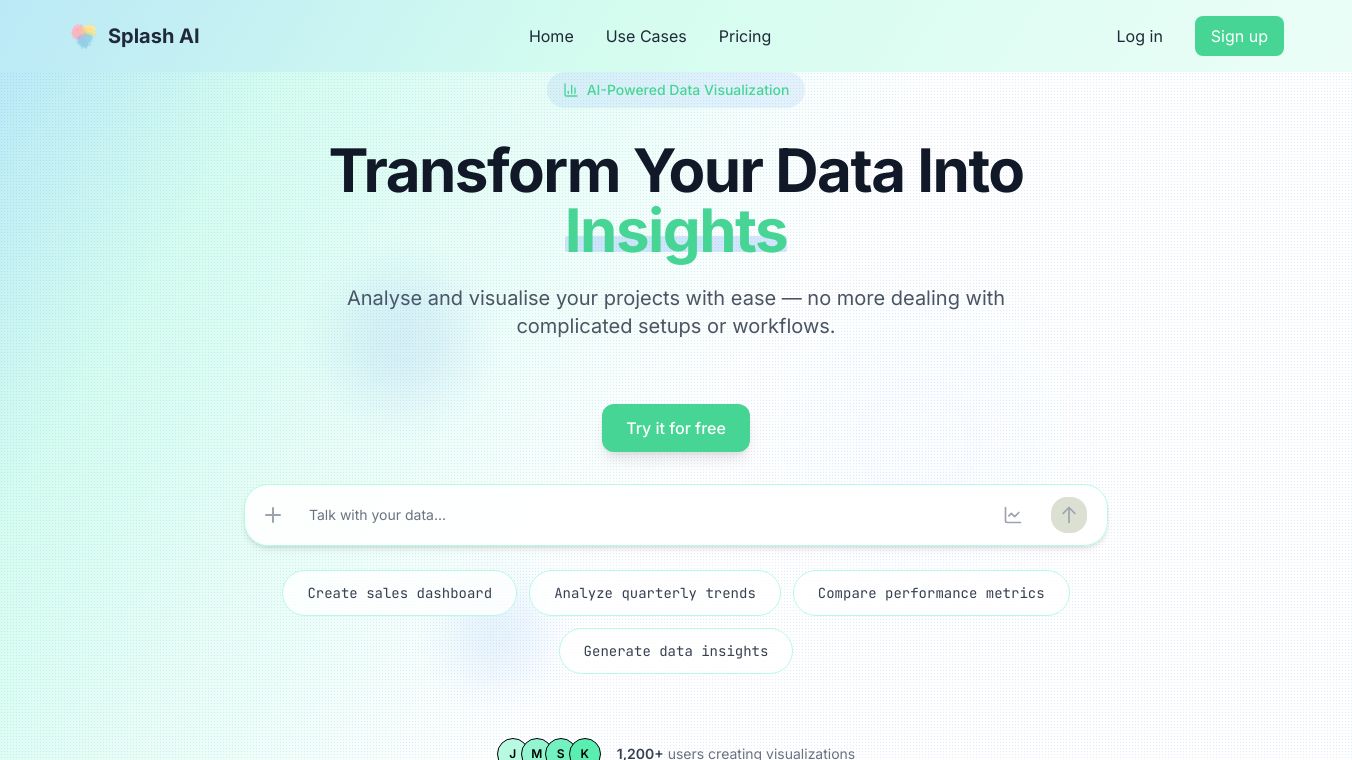
Data Visualization and Analysis with AI is a powerful tool that leverages artificial intelligence to transform complex data into clear, interactive visualizations. This technology automates data processing, generates advanced visualizations, and offers predictive analytics, making it easier for businesses to understand and act on their data.
Benefits
- Sophisticated Visualizations: AI-generated visualizations can incorporate multiple variables and dimensions, revealing insights that traditional methods might miss.
- Predictive Analytics: AI can forecast future trends based on historical data, helping organizations make proactive decisions.
- Interactive and Dynamic: AI-driven visualizations allow users to explore data from different angles, drill down into details, and adjust parameters in real-time.
- Efficiency: AI automates data preprocessing and cleaning, ensuring accurate and reliable visualizations.
- Customization: AI can tailor visualizations to the specific needs of different users or departments, ensuring relevant information is highlighted.
Use Cases
- Business Intelligence: AI-powered dashboards provide real-time monitoring and anomaly detection, helping businesses stay ahead of potential issues.
- Customer Support: AI can extract and categorize customer data from emails, streamlining response processes.
- Market Research: AI identifies and classifies key entities in social media posts and online reviews to gauge market trends.
- Healthcare: AI converts handwritten medical records into digital format for better data management and analysis.
- Manufacturing: AI identifies defects in manufacturing processes by detecting anomalies in product images.
- Retail: AI tracks product placements and monitors inventory in retail stores through image analysis.
- Fraud Detection: AI identifies unusual patterns in transaction data to detect and prevent fraudulent activities.
- Supply Chain Management: AI forecasts demand and optimizes inventory levels based on historical sales data.
- Preventive Maintenance: AI predicts equipment failures in industrial settings to schedule timely maintenance and avoid downtime.
Tools and Platforms
- Tableau with Tableau AI: Integrates AI to enhance visual analytics.
- Power BI with Azure AI: Leverages Microsoft’s AI capabilities for advanced analytics.
- Qlik Sense: Uses AI for data integration and visualization.
- Google Data Studio: Integrates with Google’s AI and machine learning tools.
- Looker: Offers a collaborative environment for data exploration and visualization.
- Sisense: Combines machine learning and predictive analytics to help users integrate and analyze data.
- Ajelix BI: Known for its one-click AI dashboard generation.
- Luzmo: Uses OpenAI's GPT-3.5 to automatically generate dashboards based on datasets.
- Polymer Search: Provides AI-generated dashboards and automatic explanations for all charts.
- Breadcrumb: Transforms raw data into interactive, personalized visualizations.
Challenges
- Data Quality: AI is only as good as the data it analyzes; poor data quality can lead to incorrect insights.
- Complexity: Implementing AI solutions requires technical expertise and can be complex.
- Bias and Fairness: AI algorithms can inherit biases present in the data, leading to skewed insights.
Future Trends
- Increased Automation: More sophisticated AI algorithms will further automate data visualization creation and analysis.
- Enhanced Interactivity: Voice and gesture-based interactions with dashboards.
- Deeper Insights: AI will provide deeper, more actionable insights as it continues to learn and adapt.
Conclusion
Data Visualization and Analysis with AI is revolutionizing how businesses interpret and act on their data. By automating data preprocessing, enhancing data analysis, and generating dynamic visualizations, AI empowers organizations to make more informed decisions. As technology evolves, the integration of AI in data visualization will continue to grow, offering even more sophisticated tools and techniques for interpreting complex data.
This content is either user submitted or generated using AI technology (including, but not limited to, Google Gemini API, Llama, Grok, and Mistral), based on automated research and analysis of public data sources from search engines like DuckDuckGo, Google Search, and SearXNG, and directly from the tool's own website and with minimal to no human editing/review. THEJO AI is not affiliated with or endorsed by the AI tools or services mentioned. This is provided for informational and reference purposes only, is not an endorsement or official advice, and may contain inaccuracies or biases. Please verify details with original sources.


Comments
Please log in to post a comment.