Chat2CSV
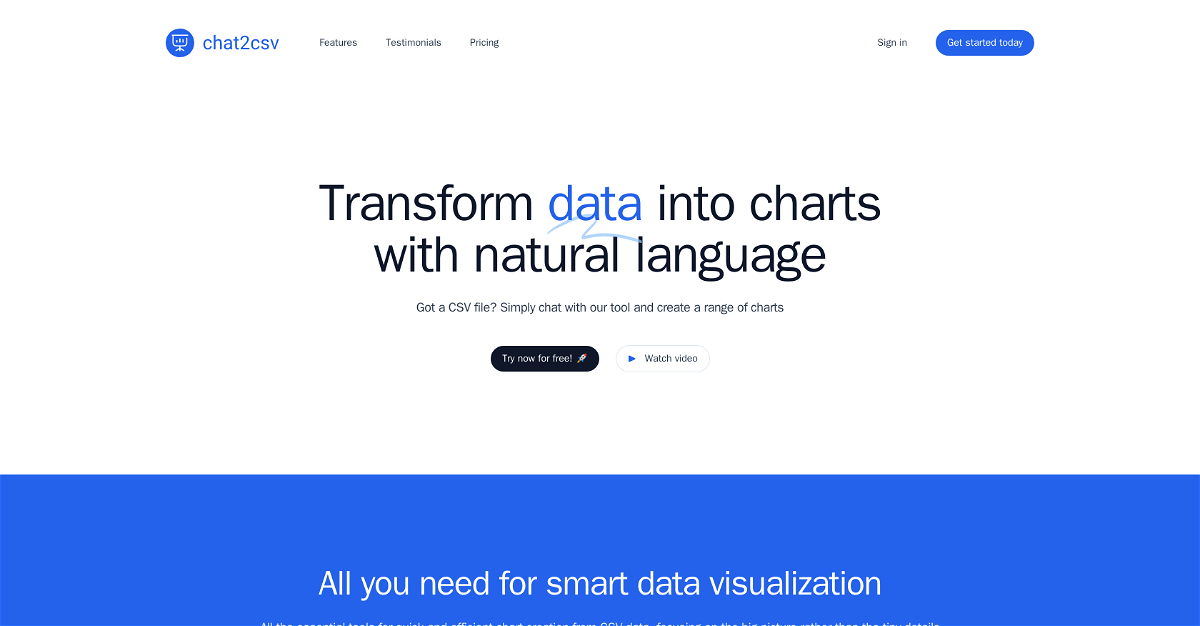
Chat CSV is a data visualization tool that makes it easy to turn your CSV files into various types of charts, using simple, everyday language. No complex coding or scripting is required – just tell Chat CSV what you want, like "create a bar chart of sales by region," and it will generate the visualization for you. The platform's AI isn't just smart enough to understand your instructions, it also suggests the most appropriate charts for your data, ensuring you get the best possible insights. With a wide range of chart types available, including pie charts, scatter plots, line graphs, and bar charts, you can effectively visualize any data. Chat CSV also prioritizes data security, only processing metadata on its servers, ensuring that your actual data remains on your device, protecting your privacy. A free version of Chat CSV is available to explore its features with minor limitations. A premium plan is also coming soon, offering increased query limits, the ability to work with multiple CSV files, larger file size limits, and cloud storage.
Highlights
- Create charts from CSV data using simple, natural language commands.
- AI-powered suggestions for the most effective charts based on your data.
- Protects your data security by only processing metadata.
Key Features
- Easy-to-use interface: Create charts with simple natural language commands.
- AI-powered suggestions: Get help choosing the most suitable charts for your data.
- Wide variety of chart types: Visualize your data with pie charts, scatter plots, line graphs, bar charts, and more.
- Data security: Your data remains private, as only metadata is processed on the servers.



Comments
Please log in to post a comment.