Chartify
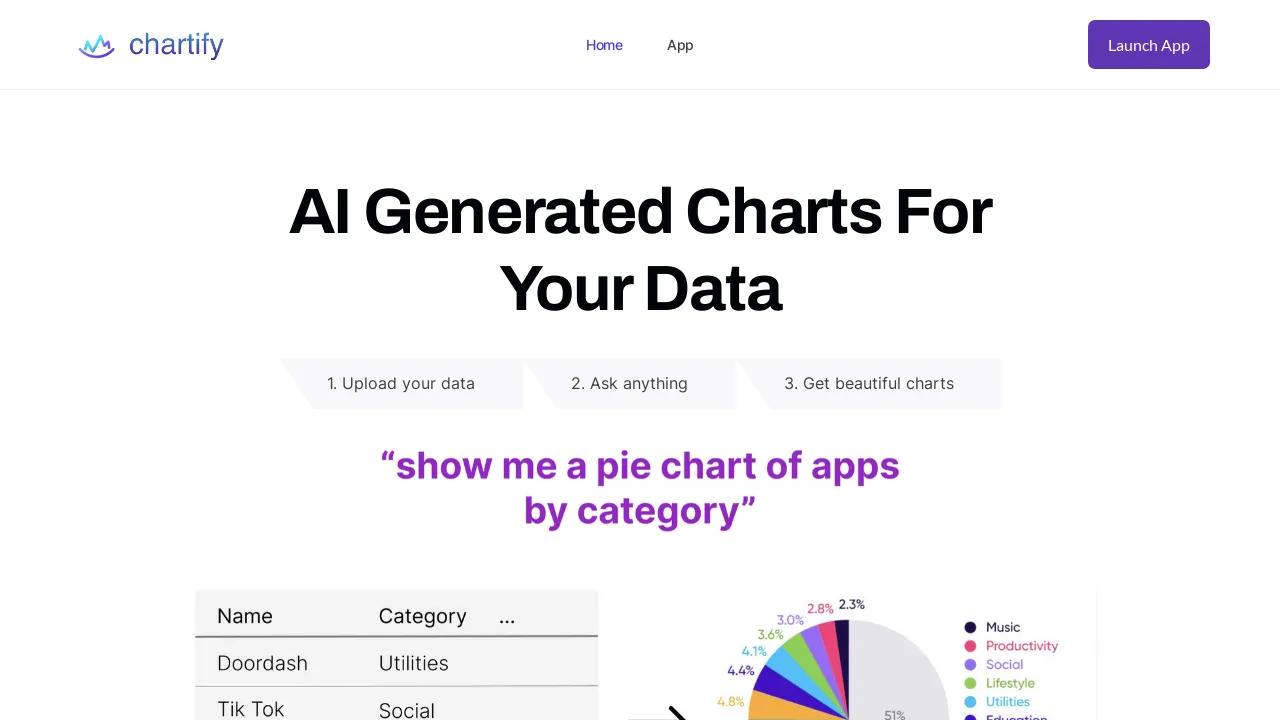
Chartify is an AI-powered tool that simplifies the process of creating interactive charts and graphs from your data. Simply upload your data in CSV, Postgres, or MySQL format, and Chartify will analyze it and suggest a range of insightful visualizations, including pie charts, bar charts, line graphs, and more. You can also request specific chart types, and Chartify will generate beautiful, customizable charts using popular libraries like Plotly, Matplotlib, Seaborn, and Chart.js. With Chartify, you can say goodbye to the frustration of manual coding or clunky spreadsheet chart editors.
Highlights
- Effortless Visualization: Generate charts effortlessly without coding or complex editing.
- AI-Powered Recommendations: Get intelligent chart suggestions based on your data.
- Customizable Charts: Create charts in a variety of styles using popular libraries.
- Intuitive Interface: Explore your data from all angles with an easy-to-use platform.
Key Features
- Supports CSV, Postgres, and MySQL data uploads.
- Recommends visualizations based on data analysis.
- Allows users to request specific chart types.
- Provides options for customization and styling.






Comments
Please log in to post a comment.