Chartberry





What is Chartberry
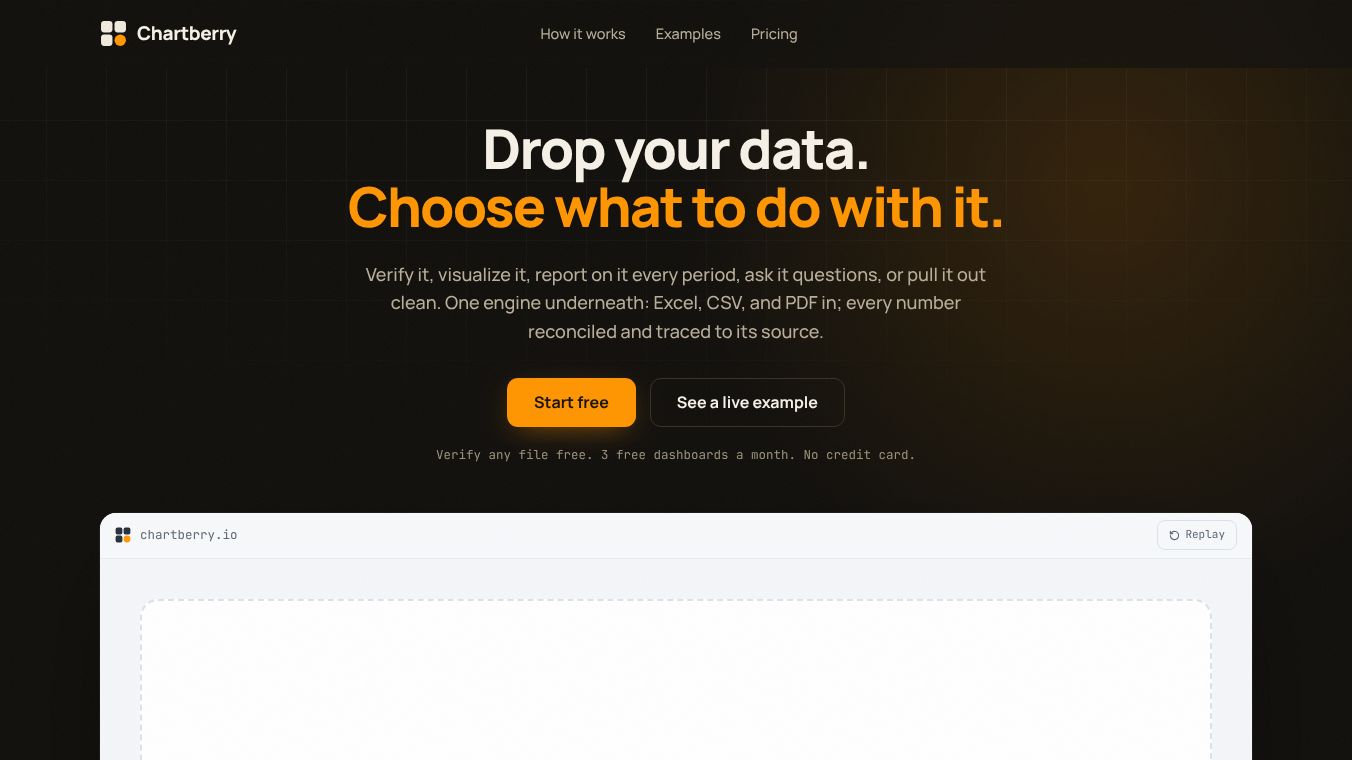
Chartberry is a web-based tool designed to help people visualize data. It turns raw numbers and spreadsheets into clear and colorful charts. The platform allows users to upload files like CSVs or Excel sheets and then choose from many different chart types. These include bar graphs, line charts, pie charts, and more. The goal is to make data easy to understand for anyone, not just experts. It works directly in a web browser, so users do not need to install any special software on their computers.
Benefits
One of the main advantages of Chartberry is its simplicity. Users can create professional-looking charts in just a few minutes. The tool offers a wide variety of chart styles to match different needs. For example, a business might use a line chart to show sales growth over time. A student could use a pie chart to display survey results. The interface is clean and easy to navigate, which reduces the learning curve. Another benefit is the ability to customize charts. Users can change colors, add labels, and adjust sizes to make their visuals stand out. This helps in presenting data clearly during meetings or reports.
Use Cases
Chartberry is useful for many different groups of people. Students can use it for school projects to visualize research data. Teachers might use it in the classroom to explain statistics to students. Business professionals can create reports for clients or internal teams. Marketers can show trends in customer behavior. Even hobbyists who track personal data, like fitness goals or budget spending, can find it helpful. The tool is also great for quick presentations. Since it runs online, users can generate charts on the fly without waiting for software to load. It supports various file formats, making it easy to work with data from different sources.
Pricing
Chartberry offers a free plan that allows users to create basic charts. This option is perfect for individuals who need occasional charting. For more advanced features, there is a paid subscription. The paid plan includes access to more chart types, higher resolution downloads, and the ability to remove branding from the charts. Pricing details may vary, and users can check the official website for the most current rates. The free tier is generous enough for most casual users, while the paid tier suits professionals who need more power and customization.
Vibes
Users generally appreciate how fast and easy Chartberry is to use. Many reviews highlight the clean design and the wide selection of chart options. People often mention that it saved them time compared to using other tools. Some users note that the free version is very capable for basic needs. There are also comments about the helpful customer support team. Overall, the community sees it as a reliable tool for turning messy data into clear stories.
Additional Information
Chartberry is part of a growing trend of online data visualization tools. It focuses on making data accessible to everyone. The company aims to simplify the process of data analysis for small businesses and individuals. While specific funding details are not widely publicized, the platform continues to update its features based on user feedback. It remains a popular choice for those looking for a straightforward way to create charts online.
This content is either user submitted or generated using AI technology (including, but not limited to, Google Gemini API, Llama, Grok, and Mistral), based on automated research and analysis of public data sources from search engines like DuckDuckGo, Google Search, and SearXNG, and directly from the tool's own website and with minimal to no human editing/review. THEJO AI is not affiliated with or endorsed by the AI tools or services mentioned. This is provided for informational and reference purposes only, is not an endorsement or official advice, and may contain inaccuracies or biases. Please verify details with original sources.




 No Info
Comments
Please log in to post a comment.